Flatness


Graphs
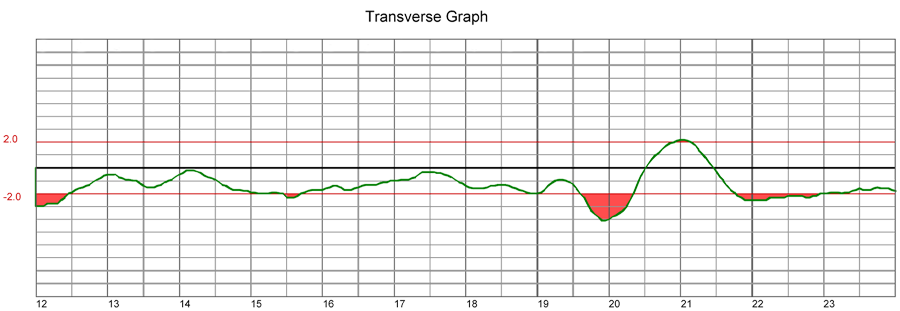
Following are survey graphs for VNA facilities. Red marks indicate the areas out of specification.
 Before Corrective Grinding
After Corrective Grinding
Before Corrective Grinding
After Corrective Grinding
...ensuring the success of the floor construction

Specialists In Industrial Flooring
Consulting - Project Management - Construction
Following are survey graphs for VNA facilities. Red marks indicate the areas out of specification.
Before Corrective Grinding
After Corrective Grinding
...ensuring the success of the floor construction